fbpx

How to Interpret Sleep Data

Are you trying to get better quality sleep and want to know what your sleep data mean? In this episode, I’m going to explain sleep hypnograms and how to use them to understand your sleep and help you sleep better.

Sleep is becoming recognised as a national health priority because it affects so many areas of life. More specifically, sleep quality and quantity are strongly linked to mental health, cognitive function and physical injury. Sleep is regulated by multiple systems in the body including your circadian control as influenced by light and dark exposure (see previous episode).

In this episode, we’ll cover

* What is sleep data?
* What is a sleep hypnogram?
* What does your sleep data mean?
* How can sleep data and hypnograms help improve sleep?

So if you want a good night’s sleep, where do you start? Let’s consider sleep data and how you can use it to make positive changes for a better night’s sleep.

What is sleep data?

Sleep data includes any information collected about sleep.

It can range from information that you manually collect or write down, to data you can collect from a wearable device to data that is collected by experienced practitioners in a sleep lab.

Manual sleep data could include a sleep diary, where you write down information such as:

  • the time you went to bed,
  • the time you woke up,
  • a subjective rating of how well you think you slept, and
  • any factors that might have influenced your sleep (e.g. caffeine intake, alcohol intake, medications, use of devices, or any worries or anxiety).

The data is relatively subjective compared to other methods.

A wearable device can be used to capture physiological data while you are asleep. The data captured may include:

  • the time you fell asleep,
  • the total duration of sleep
  • sleep phases and how long you spent in each phase,
  • sleep quality,
  • movement during the night,
  • heart rate during sleep,
  • oxygen saturation during sleep,
  • the time you work up.

These data may be available on a wearable itself, or in an app that syncs wearable data. Commonly, these data are combined using artificial intelligence (AI) to provide an overall sleep score that is visible on the device and/or on a related app. Examples include Whoop, Oura Ring, and Apple Watch.

Other ways to capture sleep data can include nearables (non-wearable trackers that are placed near the bed which measure motion, temperature, respiratory rate and other data), or mobile sleep apps (that detect motion in the night and/or may wake the person at the right time in their sleep cycle). 

The data collected by devices like the ones mentioned may be more accurate than self-reported data but are likely to be 50 – 60% as accurate as data collected in a formal sleep lab using purpose-built equipment, according to some studies. 

Many consumer wearable devices and apps use AI that is built purely from subjective data such as questionnaires, which may be biased and affect accuracy. 

There is an emerging interest in wearable devices and apps such as PhiliaHealth, whose algorithms are based on actual physiological studies in a lab, and who report other unique and more actionable data.   

In comparison to wearables, clinical sleep studies monitor aspects such as: 

  • limb movement 
  • respiratory flow 
  • electrocardiograms (heart signals) 
  • electroencephalograms (brain activity and eye movements) 
  • electromyograms (muscle movements). 

For most people, it is that manually collected data or data from a wearable that is most relevant and accessible, empowering you to take action to improve your sleep.

What is a sleep hypnogram?  

There are a few different ways to look at sleep data, and a sleep hypnogram is one of them.  

A hypnogram is a graphical representation of your sleep cycle. It is a graph of polysomnography (PSG) data that is collected during the hours that you sleep. 

The data is captured by a wearable as activity, about every 30 seconds while you sleep. While not very precise, it allows you to capture data for different stages of sleep and graph them.  

These stages and time spent in each are: 

  • Times you are awake and moving 
  • Non-REM 1 sleep (lightest sleep) (10% of sleep time) 
  • Non-REM 2 sleep (slightly deeper sleep) (50% of sleep time) 
  • Non-REM 3 sleep (also called deep sleep or slow wave sleep) (20% of sleep time) 
  • REM sleep (rapid eye movement, dream state, increased brain activity) (20% of sleep time).  

We cycle through these stages of sleep around every 90 minutes (plus or minus 20 minutes), and each person typically has 4 – 6 of these cycles each night. 

Overall, 20% of sleep is spent in the REM, dreaming phase, and about 80% is spent in non-REM (also known as N-REM). 

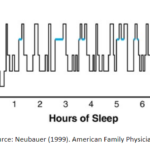
The hypnogram plot of your sleep cycle data looks something like this: 

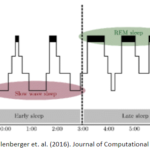
In a normal hypnogram, we might see more N-REM (Stages 1 -3) or deep sleep in the first half of the night (early sleep). Our hormonal balance is such that stimulation effects are lower at this time. 

Then, in the later part of sleep, we might notice more REM sleep in the hypnogram. During this time, the hormone acetylcholine increases to help you to process information and memories without disrupting sleep.  

People who have disruptive sleep show variations from the normal graph. They might have multiple awakenings, shorter or irregular sleep cycles, less deep sleep and/or absent sleep stages. These changes can indicate psychiatric disorders, narcolepsy, sleep disorders or medication effects (for example). 

Where can I find my sleep data? 

If you are using the PhiliaHealth app, your hypnogram can be found by clicking on the sleep icon on the daily dashboard, then scrolling down and clicking on your sleep session. 

The sleep icon shows an overall score, with total sleep time and your resting heart rate during sleep. 

Below that, the score is explained in terms of: 

  • contributing factors to good sleep (time spent in each stage and efficiency) which are colour-coded in a traffic light system to show good, ok and not so good, and 
  • penalties that lower the score (restlessness, elevated heart rate and number of awakenings).

Scroll down to see your hypnogram including the % time spent in each stage. Remember that 20% of time spent in deep sleep is ‘normal’. 

Below that, the other biometric data collected during sleep, and data on your sleep disturbances (based on arm movement). 

The traffic light colour system used in the sleep score section and the biometric data section make it easy to differentiate the positives (green) from the negatives (red). 

What does my sleep data mean? How can hypnograms help improve sleep? 

Sleep data can empower you with information that can help you make better choices to improve your sleep. According to Villanova University, sleep data can be used to: 

  • Improve knowledge and treatment of sleep conditions 
  • Identify root causes of sleep disorders 
  • Link behaviours to sleep quality 
  • Improve mattress design, and 
  • Personalise recommendations for better sleep. 

Even without going into the details of the hypnogram and without the accuracy of laboratory-based methods, you can work out whether there are issues with your sleep and when they occur. 

  • Using your hypnogram, biometric data, sleep scores and disturbance data, you can figure out whether you’re getting enough deep sleep, and when there are potential sleep issues. 
  • You might notice that your sleep score, hypnogram and biometrics are abnormal on days that you do certain things like work late, drink alcohol, experience anxiety, use devices before bed or have noise or light nearby.  
  • Your hypnogram can show at a glance whether your sleep cycles are normal or not. 

With this information, you may be able to experiment with modifying your daytime or evening behaviours or situations to improve sleep. The data might reflect positive changes in response to behaviour change. 

By looking at trends over time and whether behaviour changes cause improvements, you can work out whether you are on track or need to get professional help from a doctor or specialist. 

Summary

This episode was a deep dive into what sleep data is, what hypnograms are, what the data means and how you can use it to improve your sleep or identify a need to get help. 


References 

  1. Lavery, Michael & Stull, Carolyn & Kinney, Michael & Yosipovitch, Gil. (2016). Nocturnal Pruritus: The Battle for a Peaceful Night’s Sleep. International Journal of Molecular Sciences. 17. 425. 10.3390/ijms17030425.
  2. How to Use Sleep Data to Effectively Improve Rest. Master’s in Data Science.org website https://www.mastersindatascience.org/resources/sleep-data-to-improve-rest/ accessed 23/8/22.
  3. Neubauer, David N. MD. (1999) Johns Hopkins Sleep Disorders Center, Baltimore, MD in American Family Physician, 59(9):2551-2558, May 1, 1999.
  4. 4. Schellenberger Costa, Michael & Born, Jan & Claussen, Jens Christian & Martinetz, Thomas. (2016). Modeling the effect of sleep regulation on a neural mass model. Journal of Computational Neuroscience. 41. 10.1007/s10827-016-0602-z.
  5. 5. Wahaj Anwar A. Khan, Russell Conduit, Gerard A. Kennedy, Melinda L. Jackson, 2020. The relationship between shift-work, sleep, and mental health among paramedics in Australia. Sleep Health, Volume 6, Issue 3, 2020, Pages 330-337, ISSN 2352-7218, https://doi.org/10.1016/j.sleh.2019.12.002.
Ready to get clarity on your pathway to success?

Understanding who you are and what you need will allow your business to thrive! If you’re truly ready to break old habits and get out of the rut I encourage you to check out the Habitology membership.

Learn more here: